Implementing naming conventions using labels in checkmk

Most IT organizations have strict naming conventions for their hosts (servers, network devices and others) representing valuable information about:

  • country
  • region
  • customer
  • application
  • server
  • client
  • network
  • environment (test/production)

This list might be longer or any kind of subset of these attributes. As a sample I use my devices available in my home environment. (A review of my naming convention seems to be very urgent…)

Often naming conventions offer the ability to understand the usage of a given device, the location, or whatever. This information is also required to make your monitoring journey a success.

checkmk offers two key features to attach information of this kind to discovered hosts, labels and tags. In my opinion, the most valuable advantage of labels, compared to tags, is the ability to assign labels dynamically, without any dependency to folders or other mechanism.

This qualifies labels to dynamically apply “attributes” to hosts, using the currently valid naming conventions.

My home naming conventions are:

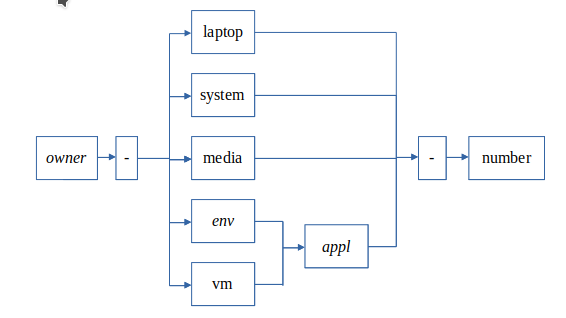
The following things I’d like to identify for monitoring:

  • the owner of the system
  • the type of the system (virtual system or physical)
  • the application, which is hosted on the system
  • the classification of the physical systems (e.g.: always online or not)

To do so, follow these steps in checkmk:

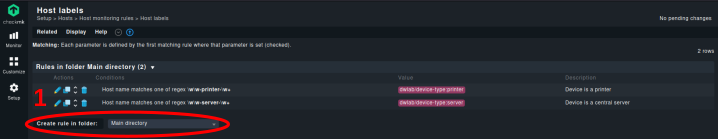
First Step: Open the setup dialog

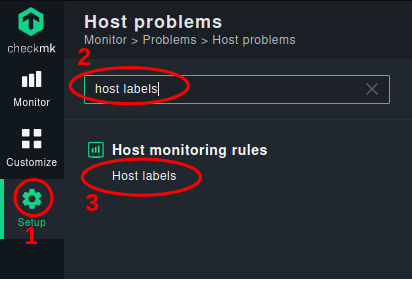
  1. Type “host labels” in the search area
  2. In the navigation bar click “Setup”
  3. Click on host labels to enter the rules area for labels

Second Step: Use the “Create rule in folder” button
As naming conventions should apply across all systems in my monitoring environment, I create these rules in the “Main directory”.


Fill in your settings

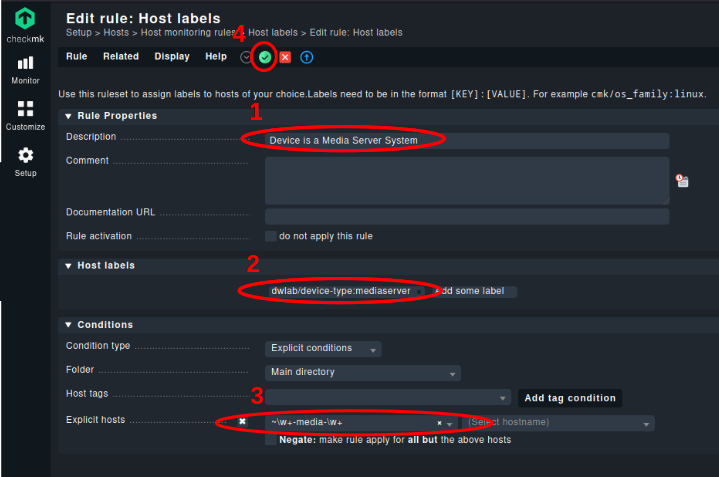
  1. A description of your Rule
  2. The label you want to attach to this set of devices (how labels work)
  3. Select explicit hosts, to write down a regular expression, selecting the focused host names. The “~” indicates, that a regular expression will follow.
  4. Don’t forget to save your changes.

After repeating the above steps for all of my weak naming convention entries, I have the following rule set.

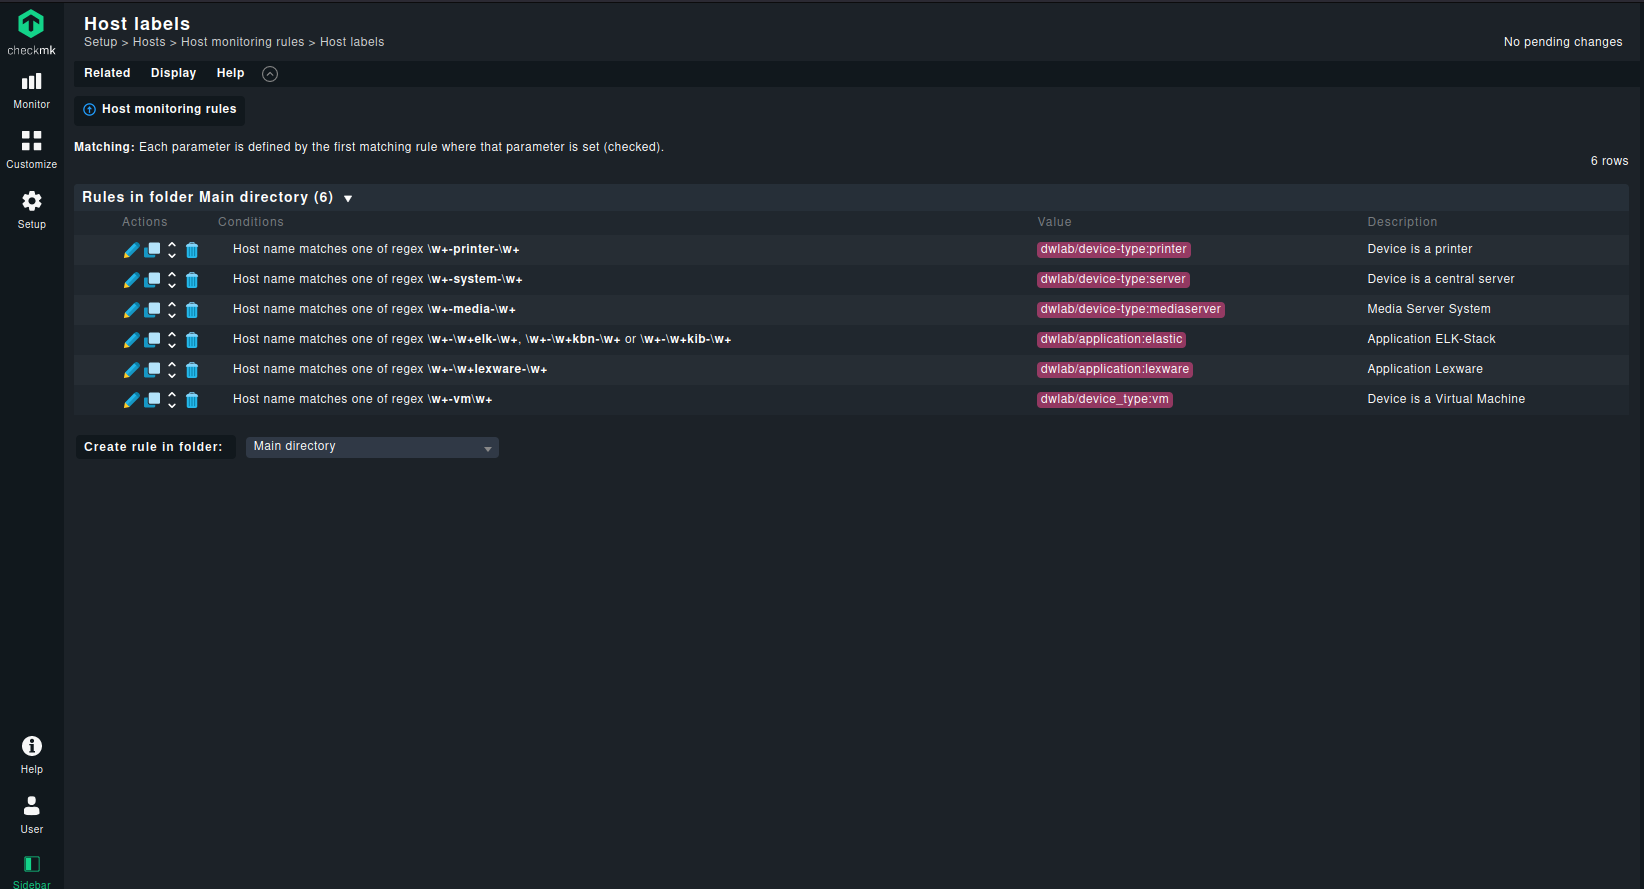
Please note, that my label names follow some conventions, to make sure, that there is no chaos introduced in the setup of checkmk.

Summary:

Labels can be implied dynamically to the hosts in your checkmk monitoring environment. Tags can’t be applied in this way. Labels can be used later on, while defining monitoring rules, views, dashboard, filters and so on. Labels are a good mechanism to group hosts in different dimensions.

Discover new devices in a Network with checkmk

After having installed checkmk it is one of the first tasks to discover all devices in a given network.

To do so please follow the steps below:

Enter Setup Hosts

Create a stage folder to place newly discovered hosts in.

Click Add Folder
Type in the Title within the basic settings and press the save button

To handle several networks, several sub-folders will be created (this is optional).

Enter stage folder and click Add folder again

Type in your specific settings and don’t forget to press the Save button
  • Select Network Scan
  • Add new IP range
  • Select Set IPv4 address
  • Set criticality host tag to “Do not monitor this host”

The Scan Interval is important, if you want detect new device quickly.

There are a lot of other settings possible. Please consult the documentation for further details (Section 6 of the linked article).

Embedding Monitoring into Existing Organizations

To ensure the success of an IT Monitoring project implementation in the long-run, the monitoring should be embedded into the existing organization with clear responsibilities and roles for each stakeholder.

In the slide below a sample organization is shown, with a typical matrix organization. This is often seen in enterprises.

There are four groups in focus regarding the monitoring deployment:

  • Users
    Most enterprises earn their money with these group of people. They expect a running application, performing well and supporting them getting their job done. These could be internal or external users or both.
  • Business
    This group are the stakeholders of the business processes and focus on getting things done, to maximize the contribution to the companies, they work for.
  • IT Application
    These people design, code, test and deploy the required applications.
  • IT Infrastructure
    This group of people are responsible to provide and run a reliable IT infrastructure and architecture for the future, including internal and external cloud platforms.

These definitions are samples, seen with different customers over the last years. Other organizations my have other setups working for them very well.

The point I want to highlight is, how to embed the monitoring into such an organization:

  • Support Level 1
    While the business support organization supports the questions from the user’s using the applications and processes supported. Often the product catalog is in focus, the order process itself, the configuration of product and so on. The questions are business driven rather than IT technical. IT technical question are rerouted to the IT support desk.
    The IT support desk is in charge for all questions, regarding IT related objects. This includes assistance for program usage help, user login issues, performance issues and so on.
  • Support Level 2
    This function is covered by an operations center. This organization keeps IT services up and running, monitors the state of key resources, applications, network and all other stuff making up a well performing IT environment. They are in charge to initiate requests to level 3 if problems arise, they can’t handle by themselves. Regarding monitoring, these people are the power user of the monitoring solution. All acquired data is used here, to provide a comprehensive overview about the IT status and to enable decisions, how to handle given situations.
  • Support Level 3
    Level 3 has several teams, contributing to this mission. Developers and system programmers have to collaborate to get solutions for serious problems arising while operating the application.
    • System programmers are in charge to fix problems with hard- and software packages and their configuration.
    • Developers have to deal with issues originating from self-developed application code.Today, these roles are often combined in so called DevOps teams. These teams are responsible to perform deep dive analysis in case of application errors, including log analysis, detailed performance measurement and threshold definition. They also have to continually develop monitoring thresholds to increase alarm accuracy. They install new monitoring tools and integrate these into the existing solution. DevOps teams always keep in mind, that any new technology requires also a new monitoring review and potentially a new monitoring component.

Monitoring should be embedded into IT management processes, best described in ITIL. Incident management, problem management and change management are the disciplines in focus. For more details on monitoring and ITIL see the Process Symphony Knowledge Base.

As I described in my blog entry Finding the best Monitoring Solution, monitoring is a process rather than a status. It is a never ending iteration of requirement review, software upgrade, solution design and execution. That’s why it is so important to embed monitoring into IT organization’s daily business.

Monitoring Focus Areas

Monitoring discussion with out a product focus.

Discussing with customers the expectations they have, regarding a monitoring system are pretty different across departments involved. As mentioned in the blog Finding the best Monitoring solution, it is essential to understand theses requirements and have these needs in focus while moving on. The monitoring solution has to support a wide range of requirements.

So let us take a look on generalized requirements without thinking in products. The slide below shows four different work areas, often causing trouble in the daily business of IT departments.

  • Monitoring
    This is the core area of a monitoring system. Gather data about any resource, regarding performance and availability.
  • Prediction
    While feeding time series data from the monitoring component and other sources (like the event management system or log analysis, this system enables to detect anomalies earlier and helps to differentiate between common behavior and unexpected processing.
  • Event Management
    Events are consolidated and correlated in one place, decreasing the complexity to follow in SOS situations where multiple components are involved and are monitored with different tools. This discipline is tremendous important, because most customers are using specialized tools to monitor their IT infrastructure, their IT network, the user experience, the cloud components/resources and so on.
  • Log Analysis
    Most IT issues are fixed by consulting the required logs. Wide spread logs hamper this activity. It is very important to collect and consolidate these logs in one place and make them actionable to search, scan, sort and analyze these information sources efficiently.

Monitoring is more than sensing the availability and performance of a single IT resource. It is essential to do so, but several other steps have to follow.

Most IT monitoring projects fail over time, because the value for the business can’t be manifested over time. IT monitoring is not a short shot project. It is more a travel which never ends. It has to change as the IT landscape changes. That means, it must be as flexible as possible to support the requirements of tomorrow. A dedicated responsibility should be defined, that supports the monitoring requirements over time. Today, DevOp departments exactly take over this role – but it helps, having a common monitoring infrastructure on hand, ready to be used, flexible enough to integrate new tools.

Finding the best Monitoring solution

Finding the best fitting monitoring solution is not an easy exercise. The market is in a fast shift and a large number of solutions is out there. Find a huge list of monitoring solutions at “100 Top Server Monitoring & Application Performance Monitoring (APM) Solutions”.

This list is a good starting point to review the different choices found in the market. All mentioned products have their strengths and weaknesses in different areas. Each solution – let us call it product – has its own focus areas:

  • Network monitoring
  • Time series processing
  • Logging
  • Application Performance
  • System Monitoring

It is important to start with the expectations of the users and stakeholders:

  • Requirement specifications
    • System Monitoring
    • Cloud Services Monitorng
    • Usage Monitoring
    • User Response Time
    • Transaction Tracking
  • User Stories & Playbooks
    • Define usage scenarios
    • User stories can help
    • Play books help prioritize activities
  • Review the existing solution(s)
    • Gap analysis
    • Efficiency
    • Serviceability
    • Support
    • Knowledge base and familiarity
  • Solution design
    • Agile Development
    • Iterate Frequently
    • Collaborate with the different teams in your organization

Having a system management solution is not a status you reach, it is more like a tour. You can’t buy a solution, install it, implement it and be happy for ever. It is more like a travel with good equipment making things easier. But the things have to be done. This leads to the awareness, that your organization has to support that function.

System management is a daily business which has to support the organization’s needs and be agile enough to fulfill changing requirements in an elastic environment.

So what is the best solution now for you and your organization?

Well, it depends on the outcome of the workshops, where the above questions are discussed and answers are defined. In most cases, there is not a single product, it is the combination of two or more products using interfaces to build a very customer specific solution.

Find a discussion of the monitoring focus areas in more detail under the blog entry Monitoring Focus Areas.

Eight steps to migrate IBM Agent Builder solutions

With the introduction of IBM Monitoring V8 a complete new user interface has been introduced and the agents also changed in the way how communicating with the server.

That implies, that all existing Agent Builder solutions you created have also to change. Agents created for your ITM V6 deployment have also to be adopted.

In this article I want to give a sample for one of my agent builder solutions, I’ve created for OpenVPN. I extend the solution in that way, that I can use it under ITM V6 as well as under APM V8.

The work to be performed is pretty limited. The documentation describes a few major prerequisites, to successfully deploy your agent to a IBM Performance Management infrastructure:

  • A minimum of one attribute group to be used generate an agent status overview dashboard.

  • These single row attribute group (or groups) will be used to provide the four other required fields for this overview

    • A status indicator for the overall service quality

    • A port number, where the service is provided

    • A host name where the agent service located

    • An IP address where the monitored service resides

For more details, please consult the documentation.

In my situation, these attributes were not provided with my ITM V6 agent builder solution. So I expanded my existing solution:

  1. Changing the version number of my agent builder solution (optional)

  2. Create a new data source “openvpnstatus_sh”, which is a script data provider delivering one single line with all attributes defined to it.
    Frame1

  3. The attribute “ReturnCode” will be used later on to describe the overall status of my OpenVPN server. So I have to define the good value and the bad value (see documentation for more details)

  4. Make sure, that the check box under Self Describing Agent is activated.

  5. Run the Dashboard Setup Wizard to produce the dashboard views

    Please make sure, that you checked “Show agent components in the dashboard”! Otherwise…

  6. Now you can select the different values:

    1. Status

    2. Additional attributes for the summary widget

    3. Select the attribute groups to be displayed in the details view for the agent

    4. Define the name of the monitored component

    5. Define the hostname where the software is running

    6. Define the IP address

    7. Define the Port Number

    8. Click “Finish”

Now your agent is almost ready. Start the Agent Builder generation process using the icon

You can generate ITM V6 and IPM V8 compatible agent packages in one step. If you do so, and you want to support Cognos Reporting, then leave “Cognos reporting” checked. While Cognos Reporting isn’t supported for new V8 agents at this time, leave it unchecked when you don’t want to support ITM V6. The agent package size will be much smaller without Cognos Report support.

After successful generating the agent package you will find the following files and directories:

  • smai-openvpnserver-08.13.00.00.tgz

  • subdirectory k00 containing fixlets for BixFix deployment of the new generated agent

After expanding the archive file you find a well known set of files:

The install routines are a now able to verify which kind of agent deployment (V6 or V8) is required. Depending on the given agent install directory, the routine determines automatically, which agent framework has to be installed.

Remark:

The Agent Builder agent has no info about where the monitoring infrastructure server is running. It will connect to the same server as the previously installed OS agent. In turn, any Agent Builder generated agent cannot run without a previously installed APM V8 agent.

Wrap-Up:

It is pretty simple to create agents for ITM V6 and APM V8 at the same time. The Agent Builder supports the two very different user interfaces in one generation process.

Only for the Dashboard definition new required data must be available, but it is simple to gather.

If you have any further questions regarding the IBM Agent Builder, drop me a message.

OMEGAMON XE for Messaging — ITM Sample Situation Package

This solution presents ITM V6.x usage scenarios for OMEGAMON XE for Messaging V7 Tivoli Enterprise Monitoring Agents.

OMEGAMON XE for Messaging V7 comes with a bunch of good, predefined situations, which have been extended in some areas. Others are defined completely new from scratch, to help customers to quickly identify and resolve production-relevant issues.

It should highlight the capabilities of the ITM V6 infrastructure and the power of using ITM situations to identify potential upcoming problems in WebSphere MQ infrastructures. It gives multiple examples for useful situations and potential solutions.

All situations have proven their value in real customer environments and have been created to show our customers the benefit of using ITM monitoring for production environments.

The attached archive file includes a detailed description of the MQ Situation Sample and the situations itself.

WebSphere MQ Monitoring — Comprehensive Workspace Sample Using Navigator Views

This solution presents ITM V6.x enhanced comprehensive workspaces in a custom navigator view for OMEGAMON XE for Messaging V7 (aka ITCAM for Application, MQ Agent).

OMEGAMON XE for Messaging V7 delivers a lot of useful workspaces with very detailed information on a single WebSphere MQ server. This solution presents a complete new approach to navigate to the details of a single MQ resources. The inspection of single objects is more context driven and spans WebSphere MQ server bounds.

The structure of the new navigator is inherited from the original product, so that the user will feel comfortable with the solution. When installed, situations are associated to the new navigation tree.

This solution should highlight the capabilities of the ITM V6 infrastructure and the power of using ITM navigator views in a production environment to identify potential upcoming problems in WebSphere MQ infrastructures.

The linking capability enables the users to follow the path of the message flows across system borders and get a more comprehensive view of the entire object chain making up the communication path in WebSphere MQ. It enables users to quickly identify the root cause of message flow problems.

The PDF document gives you all required details.

The archive file contains the export of the ITM Navigator, which could be used for a quick implementation.

Implementing a 32-bit ITM Agent under Enterprise Linux 64-bit

Implementing the ISM Agent (and other 32-bit ITM Agents) under Linux 64-bit is a little bit tricky, because it requires a 32-bit framework for the ITM base libraries.

The documentation covers all required steps, but is a litlle bit spread across IBM’s website.

In the prerequisites documentation it is stated, that the Tivoli Agent Framework is required in 32-bit architecture.

The installation is a little bit more effort, because it requires the ITM base image to be mounted and the installation of the “Tivoli Enterprise Services User Interface Extensions” has to be performed. The following modules where required on the system I used:

yum install compat-libstdc++-33.i686

yum install libXp

yum install ksh

yum install libstdc++.i686

See the general support matrix for the ISM agent. In the footnote area the required modules are listed.

Because I already installed the OS agent before, the Korn Shell has been installed before.

From the ITM install image (here: ITM_V6.3.0.6_BASE_Linux_x64) I started install.sh:

I accepted the shutdown of any running ITM Agent, and requested to install products to the local host.

After agreeing to the license agreement, the challenge is, to pick the choice to install for another operating system. As you can see from the list of the already installed components, the “Tivoli Enterprise Services User Interface” is already installed. But it is the 64-bit version only. For the ISM agent the 32-bit version is required. So we pick the option 6.

I picked option 3, “Linux x86_64 R2.6, R3.0 (32 bit)” as the OS platform.

In the next step I picked option 2, “Tivoli Enterprise Services User Interface Extensions”.

I used the ITM provided prerequisite checker to verify the software requirements again, and then accepted the installation of the new component.

I accepted all subsequent default values for the setup process and ended with the installation of the 32-bit Tivoli Agent Framework.

After having this successfully installed, the subsequent ISM Agent works really straight forward.

After successfully executing the install.sh from the ISM install image, you simply could accept the default values, if no special requirements have to be met.

After a successful installation the cinfo output should look somehow like this:

If you have further questions, please do not hesitate to drop me a reply below. I will come back to you as soon as possible.

Follow me on Twitter @DetlefWolf to continue the conversation.

Traveling To The Cloud – Predict

As I stated in my previous post, traditional monitoring approaches focusing on named systems do no longer make sense. In an agile cloud environment the system name does not matter, so in turn the performance values from this system don’t.

In such a situation the prediction approach also has to change. The data flowing into IBM Operations Analytics – Predictive Insights should no longer identify a single system nor a single instance of a resource. It should represent the sum of resources or the average usage value. So let us review a few simple examples:

While we monitor the key performance metrics of the system instance with our monitoring agents like

  • Disk I/O per second

  • Memory Usage in Megabytes

  • Network Packages sent and received

  • CPU percentage used

we feed the following values into our prediction tool:

  • SUM(Disk I/O per second) across all used OS images

  • SUM(Memory Usage in Megabytes) across all used OS images

  • SUM(Network Packages sent and received) across all used OS images

  • AVG(CPU percentage used) across all used OS images

IBM Monitoring stores historical data in the Tivoli Data Warehouse. A traditional system setup might directly leverage the data stored in the data warehouse to feed the prediction tool. With the elastic cloud approach we should add some new views to the database, which enable the required summarized data view as described above.

To ensure that a single operating system instance isn’t overloaded a traditional resource monitoring has to be deployed to each cloud participant. Distribution lists from IBM Monitoring will help to do this automatically.

These list of systems are also important to maintain the efficiency of the view’s introduced for the prediction.

The following table is required in the WAREHOUS database:

This table represents the distribution list known from IBM Monitoring.

Based on this table we can create views like the one below: With this new view we are now able to feed data regarding the disk usage into the IBM Operations Analytics – Predictive Insights tool.

The column “CloudName” is useful to identify records for streams. The “TimeFrame” column works as time dimension.

Five streams are the result from the table above:

  • AllReadRequestPerSecond

  • AllWriteRequestPerSecond

  • AvgWaitTimeSec

  • AllReadBytesPerSec

  • AllWriteBytesPerSec

All streams are generate for each single instance “CloudName”.

 In the Predictive Insights Modeling Tool the view is selectable (as a table), so that the generation of the data model is pretty straight forward.

 The SQL line


makes sure that TimeFrame is a Candle Time Stamp which is known to IBM Operations Analytics – Predictive Insights tool.

This sample shows how a data model for the cloud might look like.

With moving more and more systems to the cloud and becoming more and more agile while serving the IT workload, the monitoring approach has to become more agile as well. Also the point of view which key performance metrics matter have to change. But as you can see, the data is there, we only have to change the perspective a little bit.

So what is your approach? What requirements do you see arising while moving your monitoring and prediction tools to the cloud?

Follow me on Twitter @DetlefWolf, or drop me a discussion point below to continue the conversation.

In my next blog I will share a few ideas how to automate the implementation of IT monitoring in a cloud environment.